The agent debugger is used to test your agent, and to find and correct issues such as missing content elements.
When building an agent, you often base the design of the agent on just a few web pages, and then rely on Content Grabber to execute your commands on all similar web pages it encounters.
For example, if you are extracting data from a product catalog, you may select the product name and price on a single product detail page and add agent commands to extract those two web elements. Content Grabber will then use these two agent commands to extract product name and price for all product detail pages in the product catalog. This works fine in most cases, but some products maybe on special, and the product detail pages for those products may display the price differently. Content Grabber may be unable to pick up the discount prices and the price for some products may therefore be missing. Even if you know some products have a discount and need special attention, it may be difficult to find such a product page in a large catalog.
The agent debugger can help you correct issues where an agent is unable to locate content, because it stops and warns you when content is missing and allows you to correct the agent command that caused the error. In the product catalog example, you would be able to correct the agent command that extracts the price, so it includes a selection for the discounted price.
Controlling the Debugger
Use the Start button in the Debug ribbon tab to start the debugger.
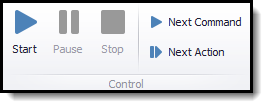
The agent will run directly in the agent editor, so you will be able to see the web pages being loaded into the web browser. The debugger will mark the content that is being processed in the web browser, and it will also highlight the command that is being executed, in the Agent Explorer panel.
Once the agent is running in the debugger, you can pause or stop the debugger at any time. If you pause the debugger, you can use the Next Command button to execute one command at a time, and the Next Action button to execute commands until the debugger reaches an action command.
Setting the Debug Speed
The debugger will mark the content that is being processed in the web browser, which is helpful when trying to work out how the agent is processing the website, but the debugger may run so fast that it's impossible to see what's going on. You can slow down the debugger to make it much easier to follow the process.
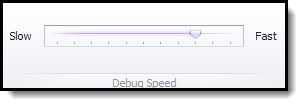
You can change the debug speed before you start the debugger or while the debugger is running.
Debugging a Data Subset
Agent list commands may process large data sets, such as a long list of Start URLs or a long list of form field input data. If you want to test an agent with data from the end of a list, it may take hours for the agent to reach the data you want to test. Instead of waiting for the agent to reach the data you want to test, you can specify the subset of data you want to include in the debugging session.
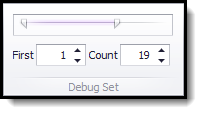
The Debug Set option is only available when you select a list command in the Agent Explorer. This setting is automatically saved to the agent command and will apply to the command every time you debug the agent. This option has no effect when you run an agent, only when you debug the agent.
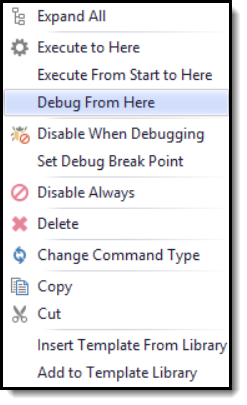
Debug From a Specific Command
Sometimes you may want to only debug a small part of your agent. If you have a complex agent that processes a large website, it may take a long time before the debugger reaches certain part of your agent, so instead of starting from the beginning, you can select the agent command where the debugger should start.
When you start debugging from a specific command, the web browser tab that is associated with the command must have a web page loaded. You cannot start debugging from a blank web page.
Disable a Command While Debugging
When debugging a complex agent that processes a large website, it's often useful to exclude parts of the agent, so you only execute the part of the agent you want to test. you can do this by disabling commands while debugging.
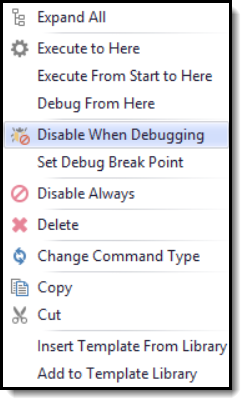
When you disable a container command, all sub-commands are also automatically disabled.
This setting is automatically saved to the agent command, so the command will be disabled every time you debug the agent until you enable the command again. This setting has no effect when you run an agent, only when you debug the agent.
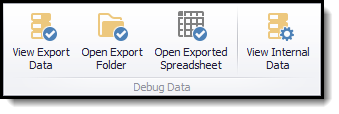
Viewing Debug Data
Data collected while debugging an agent is saved to a separate data store, so it doesn't overwrite data that is collected when you run the agent. The debugger will export data to your chosen export target, but it will never distribute data. If you are exporting data to a database, the debugger will create separate data tables for the debug data. If you are exporting data to a file format, the files will be written to the agent's debug data folder.
Important: If you are using a script to export data, you are responsible for managing debug data if you want to separate debug data from normal data.
Please see the Data topic for more information about agent data.